:max_bytes(150000):strip_icc():format(jpeg)/TSLAChart-6ed535d3814b407aa91f6de45de4c1cc.gif)
Key Takeaways
- Tesla shares soared to a new all-time high Wednesday as the stock gained ground for the sixth straight day, extending a huge post-election rally.
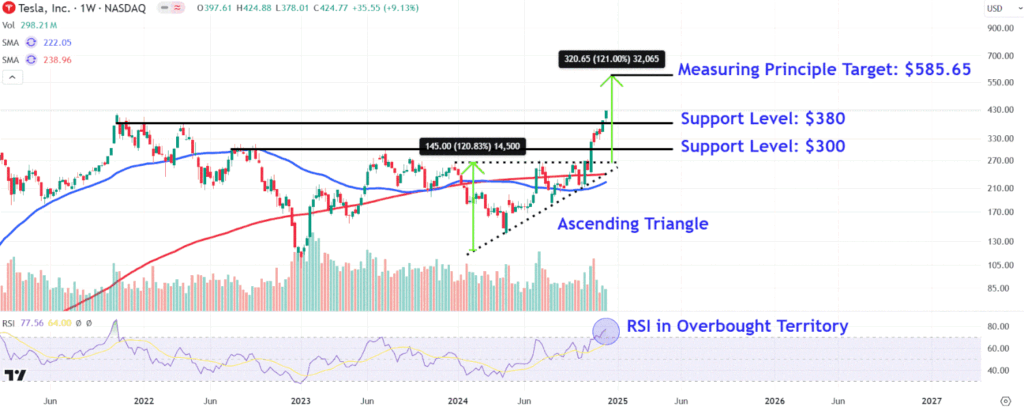
- Since breaking out from an ascending triangle early last month following the election, Tesla shares have continued to trend sharply higher.
- The measuring principle, which calculates the percentage change between the ascending triangle’s lower and upper trendlines and adds it to the pattern’s top trendline value, forecasts a bullish price target of $585.65.
- Investors should watch key support levels on Tesla’s chart around $380 and $300.
Tesla (TSLA) shares soared to a new all-time high Wednesday as the stock gained ground for the sixth straight day, extending a huge post-election rally.
Wednesday’s gains followed bullish commentary from Wall Street analysts, with Goldman Sachs saying that the EV maker’s push into self-driving cars and robotics could benefit from the artificial intelligence (AI) boom, while Morgan Stanley analyst Adam Jonas named the company’s stock as his “Top Pick.”
Tesla shares rose 5.9% to $424.77 on Wednesday, hitting a record high for the first time since November 2021. The stock has surged about 70% since election day last month on optimism that CEO Elon’s Musk’s close association with President-elect Donald Trump could benefit the automaker.
Below, we analyze the technicals on Tesla’s weekly chart and identify key price levels that investors may be watching out for as the stock moves into blue sky territory.
Ascending Tringle Breakout Accelerates
Since breaking out from an ascending triangle early last month following the presidential election, Tesla shares have continued to trend sharply higher.
The relative strength index (RSI) confirms bullish price momentum with a reading above the 70 threshold, though the indicator also cautions of overbought conditions in the stock, increasing the chances for near-term profit taking.
Given the shares have moved into price discovery mode, let’s turn to technical analysis to forecast a potential bullish price target, but also point out key support levels to keep an eye on during possible pullbacks.
Bullish Price Target
Investors can forecast a bullish price target by using the measuring principle, also known by chart watchers as the measured move technique.
To apply the tool to Tesla’s chart, we calculate the percentage change between the ascending triangle’s lower and upper trendlines and add it to the pattern’s top trendline value. For instance, we apply a 121% increase to $265, which projects a bullish target of $585.65, a region where investors may be satisfied to lock in profits.
Key Support Levels to Monitor
During retracements, investors should initially monitor the $380 level. This area, about 11% below Wednesday’s closing price, may attract support near several peaks that formed on the chart between November 2021 and April 2022.
Tesla bulls’ failure to defend this level could see the stock retreat to around $300. Investors may seek to scoop up shares in this location near the psychological round number and a trendline that connects a series of highs over a 12-month period from July 2022 to July last year.
The comments, opinions, and analyses expressed on Investopedia are for informational purposes only. Read our warranty and liability disclaimer for more info.
As of the date this article was written, the author does not own any of the above securities.

